
Digital Illustration
DIGITAL ILLUSTRATION
Building the Elements of the Infographic
Digital illustrations designed to capture and communicate typical green infrastructure practices.

Roof Garden

Pervious Pavement

Bioretention Cell

Pervious Pavers

Building the Infographic
Beautiful visualizations reflect the qualities of the data and information that they represent, explicitly revealing properties and relationships inherent and implicit in the concept or source data.

Beautiful visualizations reflect the qualities of the data and information that they represent, explicitly revealing properties and relationships inherent and implicit in the concept or source data.
Hanley Wood Media Penetration and Influence
Market and Media Source Layouts
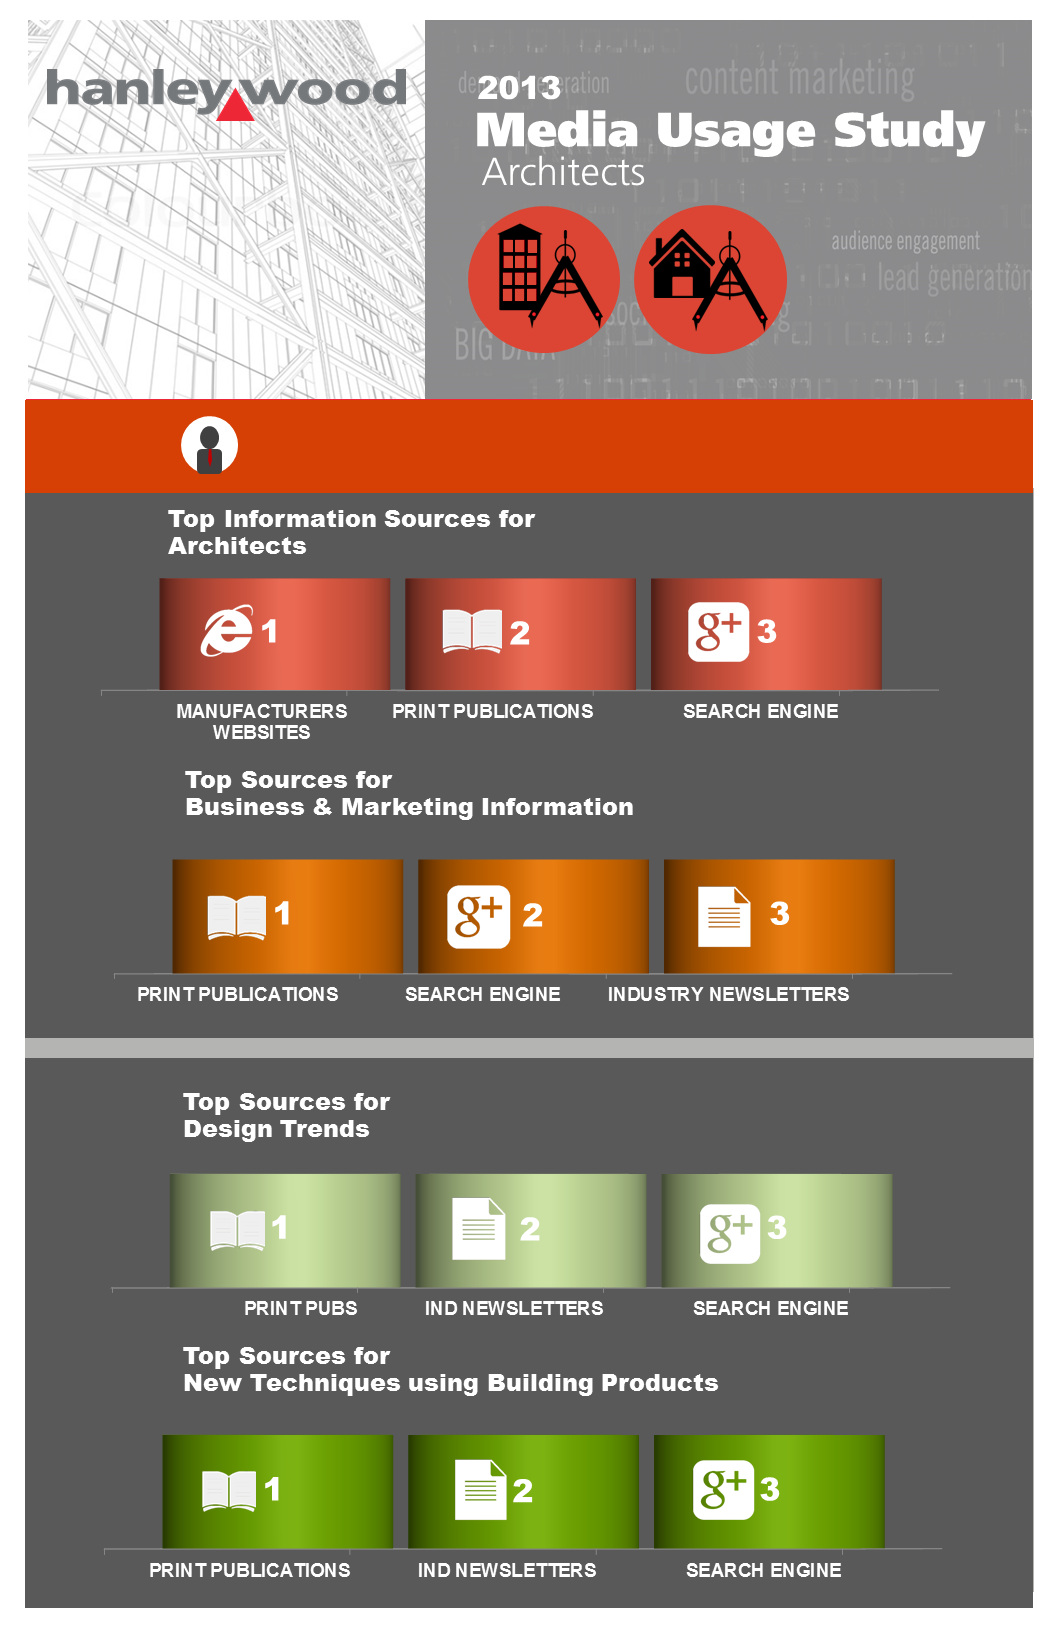
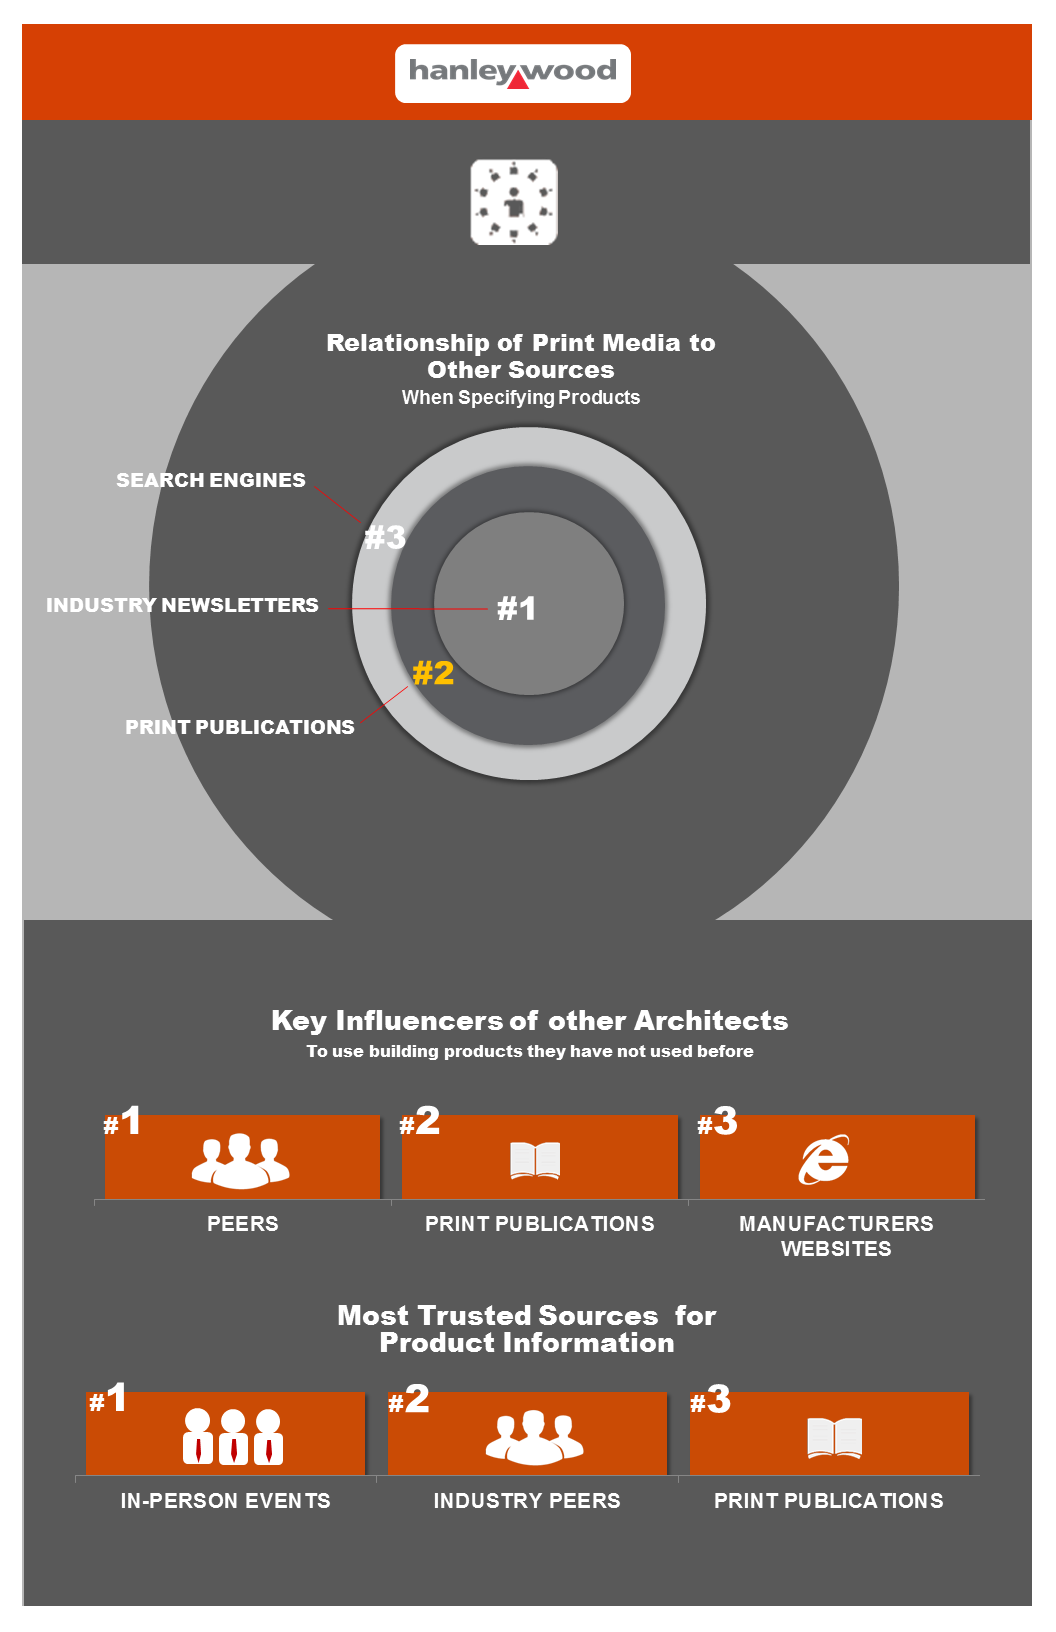
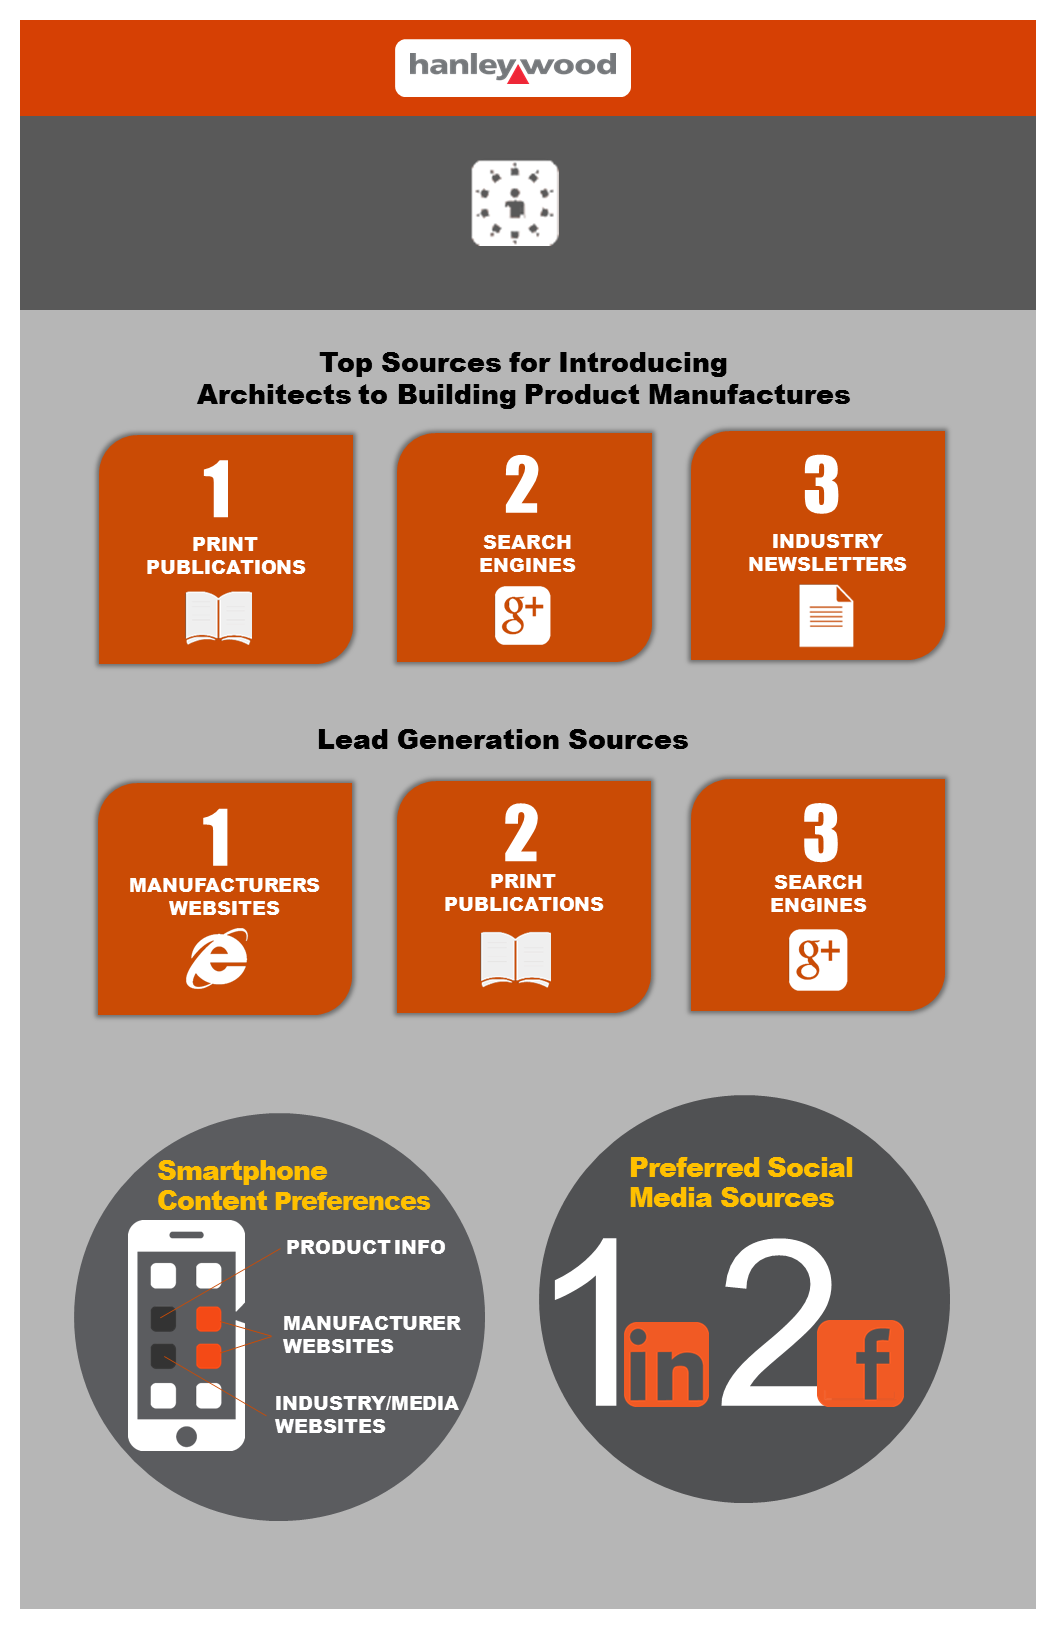
Integrated Sources Infographic Layout

2013-14 Trends Analysis Presentation


EXAMPLE graphic analysis-
Institute of Hazardous Materials Management
INFOGRAPHIC


